| 일 | 월 | 화 | 수 | 목 | 금 | 토 |
|---|---|---|---|---|---|---|
| 1 | 2 | 3 | 4 | 5 | 6 | |
| 7 | 8 | 9 | 10 | 11 | 12 | 13 |
| 14 | 15 | 16 | 17 | 18 | 19 | 20 |
| 21 | 22 | 23 | 24 | 25 | 26 | 27 |
| 28 | 29 | 30 | 31 |
- ARM
- MDP
- 파이토치 트랜스포머를 활용한 자연어 처리와 컴퓨터비전 심층학습
- fastapi를 사용한 파이썬 웹 개발
- study book
- Dreamhack
- PCA
- llm을 활용 단어장 앱 개발일지
- rao
- Algorithm
- Kaggle
- BAEKJOON
- 영상처리
- Got
- 백준
- pytorch
- Image Processing
- bloc
- BFS
- Widget
- DART
- MATLAB
- Computer Architecture
- Flutter
- Stream
- FastAPI
- ML
- BOF
- C++
- system hacking
- Today
- Total
Bull
[kaggle] Single model baseline: XGBoost - Review하기 본문
[kaggle] Single model baseline: XGBoost - Review하기
Bull_ 2024. 7. 22. 18:52이 글은 친구와 kaggle에 익숙해지기 위해 스터디하는 걸 정리해봤습니다.
목적으로 코드도 중요하지만 데이터를 어떻게 다루고 왜 다루고 전처리는 어떤 방식으로 하는 지 궁금해기 때문에 하나하나 관찰하며 혜안을 얻고자 하는 목적입니다.
CODE
https://www.kaggle.com/code/rzatemizel/single-model-baseline-xgboost
Single model baseline: XGBoost
Explore and run machine learning code with Kaggle Notebooks | Using data from multiple data sources
www.kaggle.com
Dataset
https://www.kaggle.com/competitions/playground-series-s4e7
Binary Classification of Insurance Cross Selling | Kaggle
www.kaggle.com
보험 가입 예측 모델 개발과 SHAP을 이용한 해석
이 포스트에서는 머신러닝 모델을 사용하여 고객의 보험 가입 여부를 예측하는 과정을 설명합니다.
1. 패키지 로드
먼저 필요한 라이브러리들을 불러옵니다. 데이터 조작을 위해 pandas와 numpy를, 시각화를 위해 seaborn과 matplotlib을 사용합니다. 머신러닝 모델 학습과 평가를 위해 xgboost와 scikit-learn을 사용합니다.
import numpy as np
import pandas as pd
import seaborn as sns
import matplotlib.pyplot as plt

import warnings
warnings.filterwarnings("ignore")

from sklearn.feature_selection import mutual_info_classif
from xgboost import XGBClassifier
import xgboost as xgb
from sklearn.model_selection import train_test_split
from sklearn.metrics import roc_auc_score, roc_curve, confusion_matrix, ConfusionMatrixDisplay

random_state = 42
2. 데이터 로드 및 초기 확인
훈련 데이터와 테스트 데이터를 불러오고, 데이터의 크기를 확인합니다.
train_df = pd.read_csv('/kaggle/input/playground-series-s4e7/train.csv', index_col=[0])
test_df = pd.read_csv('/kaggle/input/playground-series-s4e7/test.csv', index_col=[0])
original_df = pd.read_csv('/kaggle/input/health-insurance-cross-sell-prediction/train.csv', index_col=[0])

print(train_df.shape)
print(test_df.shape)
print(original_df.shape)
3. 기술 통계 및 타겟 변수 분포 시각화
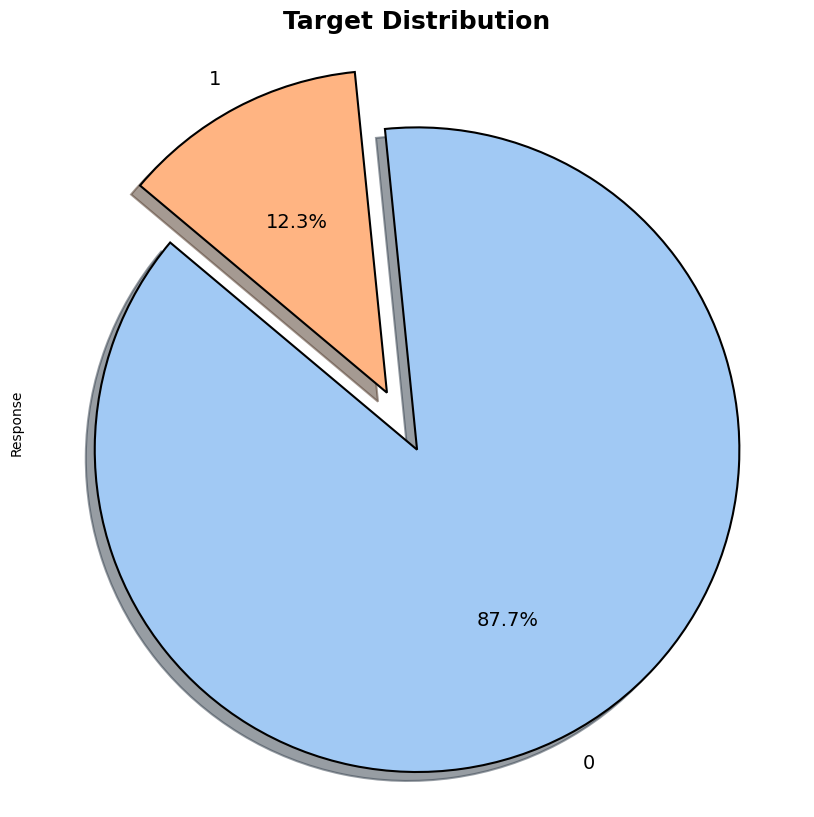
수치형 변수의 기술 통계를 확인하고, 타겟 변수의 분포를 파이 차트로 시각화합니다.
train_df.describe().T

plt.figure(figsize=(10, 10))
palette_color = sns.color_palette('pastel')
explode = [0.1 for _ in range(train_df['Response'].nunique())]

train_df.groupby('Response')['Response'].count().plot.pie(
    colors=palette_color,
    explode=explode,
    autopct="%1.1f%%",
    shadow=True,
    startangle=140,
    textprops={'fontsize': 14},
    wedgeprops={'edgecolor': 'black', 'linewidth': 1.5}
)

plt.title('Target Distribution', fontsize=18, weight='bold')
plt.axis('equal')
plt.show()
대부분의 회원들이 보험의 가입을 하지 않았음을 알 수 있습니다.
4. 데이터 전처리
연속형 변수, 이진 변수, 범주형 변수를 정의하고 전처리합니다.
feature_list = [feature for feature in train_df.columns if not feature == "Response"]
target = "Response"

binary_features = ['Previously_Insured','Driving_License']
categorical_features = ['Gender', 'Vehicle_Age', 'Vehicle_Damage']

train_df[categorical_features] = train_df[categorical_features].astype('category')
test_df[categorical_features] = test_df[categorical_features].astype('category')
original_df[categorical_features] = original_df[categorical_features].astype('category')

continuous_features = list(set(feature_list) - set(binary_features) - set(categorical_features))
assert feature_list.sort() == (continuous_features + binary_features + categorical_features).sort()
여기서 continuous_features는 feature_list에서 이진 변수(binary_features)와 범주형 변수(categorical_features)를 제외한 나머지 피처들로 구성됩니다. 이는 연속형 변수만을 포함하는 리스트를 생성하여, 이후 모델링 및 데이터 분석에서 이 변수들을 따로 처리하기 위함입니다.
5. 탐색적 데이터 분석 (EDA)
데이터의 일부 샘플을 사용하여 EDA를 수행합니다.
eda_df = train_df.sample(frac=0.01)
fig, ax = plt.subplots(2, 3, figsize=(30, 20))
for var, subplot in zip(continuous_features, ax.flatten()):
    sns.boxplot(x='Response', y=var, data=eda_df, ax=subplot, palette='Set3')

fig, ax = plt.subplots(1, 2, figsize=(20, 10))
for var, subplot in zip(binary_features, ax.flatten()):
    sns.barplot(x=var, y='Response', data=eda_df, ax=subplot, palette='Set3')

fig, ax = plt.subplots(1, 3, figsize=(30, 10))
for var, subplot in zip(categorical_features, ax.flatten()):
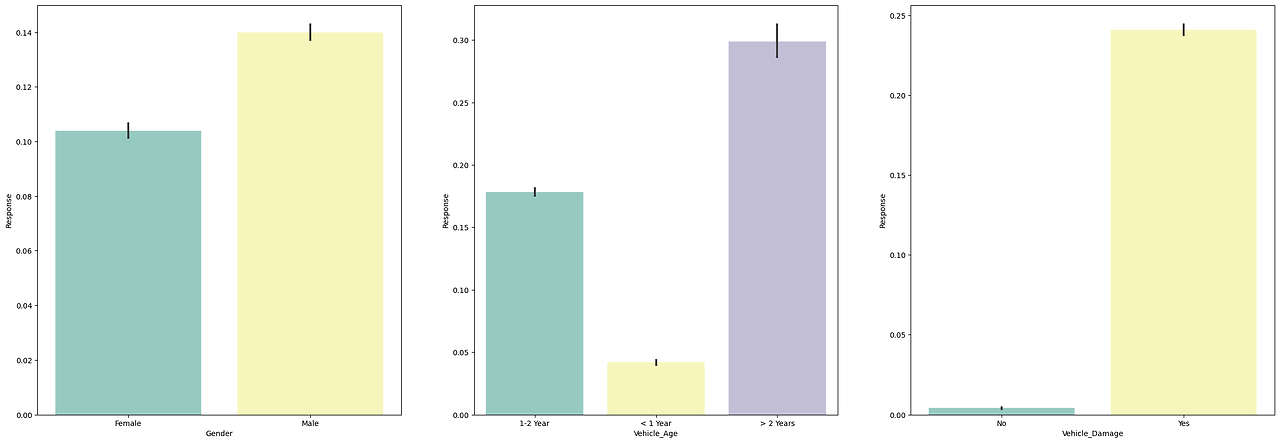
    sns.barplot(x=var, y='Response', data=eda_df, ax=subplot, palette='Set3')
연속형 데이터와의 분포관계

이진형 데이터(이산)와의 분포관계

카테고리형 데이터(이산)와의 분포관계

6. 피처 엔지니어링 및 상호 정보 계산
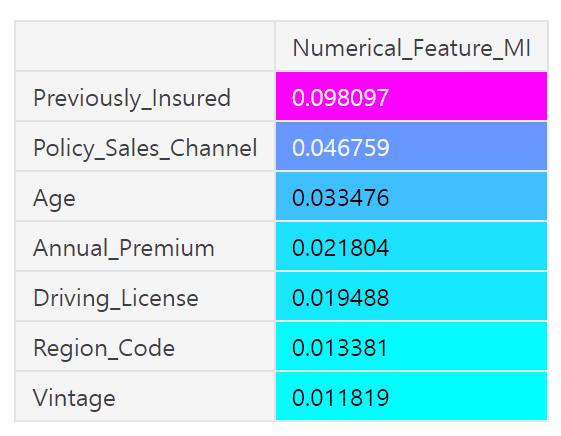
수치형 변수와 이진 변수의 상호 정보를 계산하여 각 변수의 중요도를 평가합니다.
mutual_df = eda_df[continuous_features + binary_features]
y_sampled = eda_df.Response
mutual_info = mutual_info_classif(mutual_df, y_sampled, random_state=random_state)

mutual_info = pd.Series(mutual_info)
mutual_info.index = mutual_df.columns
mutual_info = pd.DataFrame(mutual_info.sort_values(ascending=False), columns=["Numerical_Feature_MI"])
mutual_info.style.background_gradient("cool")
이 코드는 각 변수(continuous_features와 binary_features)가 타겟 변수(Response)와 얼마나 관련이 있는지 평가하기 위해 상호 정보를 계산합니다. 상호 정보는 각 피처가 타겟 변수의 변동을 설명하는 데 얼마나 유용한지를 측정합니다. 높은 값은 해당 피처가 타겟 변수와 강한 상관 관계를 가지며 중요한 역할을 한다는 것을 의미합니다.
mutual_df_categorical = eda_df[categorical_features]
#categorical features must be encoded to get mutual information
for colname in mutual_df_categorical:
    mutual_df_categorical[colname], _ = mutual_df_categorical[colname].factorize()
mutual_info = mutual_info_classif(mutual_df_categorical, y_sampled, random_state=random_state)

mutual_info = pd.Series(mutual_info)
mutual_info.index = mutual_df_categorical.columns
pd.DataFrame(mutual_info.sort_values(ascending=False), columns = ["Categorical_Feature_MI"] ).style.background_gradient("cool")
위와 같이 카테고리형 특징에 대한 상호정보입니다.
내가 몰랐던 내용
상호 정보 (Mutual Information)
상호 정보는 정보 이론에 기반한 개념으로, 두 변수 간의 의존성, 두 변수가 얼마나 많이 서로의 불확실성을 줄여주는지를 나타냅니다. 상관 관계와는 다른 내용이므로 일단 다른 개념이라는 것만 알고 넘어가겠습니다.

7. 모델링 및 하이퍼파라미터 튜닝
훈련 데이터를 학습 및 검증 세트로 나누고, XGBoost 모델을 사용하여 예측 모델을 훈련합니다.
y = train_df.Response
train_df = train_df.drop("Response", axis=1)
X_train, X_val, y_train, y_val = train_test_split(train_df, y, test_size=0.2, random_state=42, stratify=y)
X_train = pd.concat([original_df.drop('Response', axis=1), X_train]).reset_index(drop=True)
y_train = pd.concat([original_df['Response'], y_train]).reset_index(drop=True)

model = XGBClassifier(
    n_estimators=10000,
    eta=0.05,
    alpha=0.2545607592482198,
    subsample=0.8388163485383147,
    colsample_bytree=0.2732499701466825,
    max_depth=16,
    min_child_weight=5,
    gamma=0.0017688666476104672,
    eval_metric='auc',
    random_state=random_state,
    max_bin=262143,
    enable_categorical=True
)

model.fit(
    X_train,
    y_train,
    eval_set=[(X_val, y_val)],
    early_stopping_rounds=50,
    verbose=500
)

print("Best iteration:", model.best_iteration)
booster = model.get_booster()
y_pred_prob = booster.predict(xgb.DMatrix(X_val, enable_categorical=True), iteration_range=(0, model.best_iteration + 1))
auc = roc_auc_score(y_val, y_pred_prob)
print(f"Validation AUC: {auc:.5f}")
여기서 모델은 각 데이터 포인트가 긍정 클래스(예: 보험 가입할 확률)일 확률을 예측합니다. 예측값이 소수로 나타나는 이유는 모델이 각 데이터 포인트가 특정 클래스에 속할 확률을 예측하기 때문입니다.
8. 모델 해석 및 피처 중요도
Yellowbrick와 SHAP을 사용하여 모델의 예측 결과를 해석하고 피처 중요도를 시각화합니다.
from yellowbrick.features import FeatureImportances
from yellowbrick.classifier import ConfusionMatrix, ClassificationReport, ROCAUC, DiscriminationThreshold

fig, axes = plt.subplots(2, 2, figsize=(15, 15))

model.importance_type = 'total_gain'

visualgrid = [
    FeatureImportances(model, ax=axes[0][0], colormap='winter'),
    ConfusionMatrix(model, ax=axes[0][1], cmap='GnBu'),
    ClassificationReport(model, ax=axes[1][0], cmap='GnBu'),
    ROCAUC(model, ax=axes[1][1]),
]

for viz in visualgrid:
    viz.fit(X_train, y_train)
    viz.score(X_val, y_val)
    viz.finalize()

plt.show()
또다른 방법으로는 SHAP 모델이 있습니다.
import shap

model = model
explainer = shap.TreeExplainer(model, feature_perturbation='interventional')
test_explain = X_val.sample(n=1000, random_state=random_state)
shap_values = explainer.shap_values(test_explain, check_additivity=False)

shap.summary_plot(shap_values, test_explain, max_display=len(X_val))
SHAP(SHapley Additive exPlanations)은 각 피처가 예측에 미치는 영향을 설명하는 도구입니다. SHAP summary plot에서 x축은 SHAP 값을 나타내며, 이는 각 피처가 예측값에 기여한 정도를 의미합니다. 빨간색 점은 피처 값이 높은 경우를, 파란색 점은 피처 값이 낮은 경우를 나타냅니다.
내가 몰랐던 내용
SHAP(SHapley Additive exPlanations)
SHAP는 머신러닝 모델의 예측 결과를 설명하기 위한 방법론입니다. SHAP는 Shapley 값을 사용하여 각 피처가 예측에 얼마나 기여했는지를 계산합니다. Shapley 값은 게임 이론에서 각 플레이어(피처)가 결과에 기여한 정도를 공정하게 분배하는 방법입니다. SHAP는 모델 불가지론적 접근법으로, 다양한 모델 유형에 적용할 수 있으며, 예측을 피처 기여도의 합으로 분해하여 설명합니다. 이를 통해 글로벌 해석에서는 전체 데이터셋에서 피처 중요도를 분석하고, 로컬 해석에서는 개별 예측에 대한 피처 기여도를 분석할 수 있습니다.
9. 제출 파일 생성
테스트 데이터에 대한 예측을 수행하고 결과를 저장합니다.
test_df_d = xgb.DMatrix(test_df, enable_categorical=True)
sub_preds = booster.predict(test_df_d, iteration_range=(0, model.best_iteration + 1))
output = pd.DataFrame({'id': test_df.index, 'Response': sub_preds})

output.to_parquet('submission.parquet', index=False)
여기서 Response 예측이 소수로 나오는 이유는 모델이 각 데이터 포인트가 긍정 클래스(예: 보험 가입할 확률)에 속할 확률을 예측하기 때문입니다.
10. 확률 임계값 조정
작성자는 이 부분을 할 필요는 없지만 Just for fun으로 한 부분인 거 같습니다.
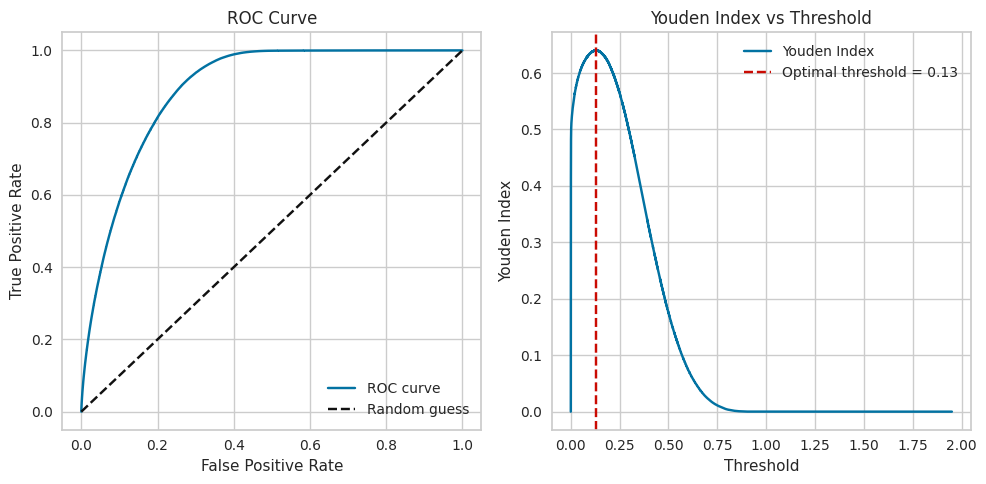
ROC 곡선과 Youden 지수를 사용하여 최적의 임계값을 찾고, 이에 따른 혼동 행렬을 업데이트합니다.
from ipywidgets import interact, FloatSlider

fpr, tpr, thresholds = roc_curve(y_val, y_pred_prob)
youden_index = tpr - fpr
optimal_threshold = thresholds[np.argmax(youden_index)]
max_youden_index = np.max(youden_index)

print(f"Optimal threshold: {optimal_threshold}")
print(f"Maximum Youden Index: {max_youden_index}")

def update_confusion_matrix(threshold):
    final_preds = (y_pred_prob >= threshold).astype(int)
    cm = confusion_matrix(y_val, final_preds)
    disp = ConfusionMatrixDisplay(confusion_matrix=cm, display_labels=model.classes_)
    disp.plot(cmap='Blues')
    plt.title(f'Confusion Matrix at threshold = {threshold:.2f}')
    plt.show()

plt.figure(figsize=(10, 5))

plt.subplot(1, 2, 1)
plt.plot(fpr, tpr, label='ROC curve')
plt.plot([0, 1], [0, 1], 'k--', label='Random guess')
plt.xlabel('False Positive Rate')
plt.ylabel('True Positive Rate')
plt.title('ROC Curve')
plt.legend()

plt.subplot(1, 2, 2)
plt.plot(thresholds, youden_index, label='Youden Index')
plt.axvline(x=optimal_threshold, color='r', linestyle='--', label=f'Optimal threshold = {optimal_threshold:.2f}')
plt.xlabel('Threshold')
plt.ylabel('Youden Index')
plt.title('Youden Index vs Threshold')
plt.legend()

plt.tight_layout()
plt.show()

interact(update_confusion_matrix, threshold=FloatSlider(value=optimal_threshold, min=0.0, max=1.0, step=0.01))

Youden 지수는 민감도(Sensitivity)와 특이도(Specificity)를 결합하여 하나의 값으로 나타냅니다. 이 지수는 모델의 최적 임계값(threshold)을 선택하는 데 유용합니다. Youden 지수가 최대가 되는 임계값을 선택하여 모델의 성능을 최적화할 수 있습니다.
내가 몰랐던 내용
Youden 지수(Youden's J Index)
Youden 지수는 진단 테스트의 성능을 평가하는 지표로, 모델의 민감도(Sensitivity)와 특이도(Specificity)를 결합하여 하나의 값으로 나타냅니다. Youden 지수는 진단 정확도를 최적화하는 임계값을 선택하는 데 유용합니다. 계산 공식은 민감도와 특이도의 합에서 1을 뺀 값으로,
$Youden’s J=Sensitivity+Specificity−1$
입니다. 이 지수는 -1에서 1 사이의 값을 가지며, 값이 클수록 모델의 성능이 좋음을 의미합니다. Youden 지수가 최대가 되는 임계값은 모델이 가장 잘 분류하는 지점을 나타내며, 이를 통해 최적의 임계값을 설정할 수 있습니다. 예를 들어, ROC 곡선을 통해 다양한 임계값에서 민감도와 특이도를 계산하고, 최대 Youden 지수를 찾는 과정에서 최적의 임계값을 선택합니다.
'Artificial Intelligence > kaggle' 카테고리의 다른 글
| [kaggle] 🐘Greyscale MobileNet [LB=0.892] - Review 하기 (0) | 2024.08.05 |
|---|---|
| [kaggle] Image compression using PCA - Review 하기 (0) | 2024.07.29 |
| [kaggle] Gensim Word2Vec Tutorial - Review하기 (0) | 2024.07.21 |


