| 일 | 월 | 화 | 수 | 목 | 금 | 토 |
|---|---|---|---|---|---|---|
| 1 | 2 | 3 | 4 | 5 | 6 | |
| 7 | 8 | 9 | 10 | 11 | 12 | 13 |
| 14 | 15 | 16 | 17 | 18 | 19 | 20 |
| 21 | 22 | 23 | 24 | 25 | 26 | 27 |
| 28 | 29 | 30 | 31 |
- BAEKJOON
- 백준
- Got
- 영상처리
- bloc
- Image Processing
- Algorithm
- C++
- Flutter
- Stream
- BOF
- ML
- system hacking
- DART
- ARM
- llm을 활용 단어장 앱 개발일지
- Widget
- FastAPI
- MDP
- fastapi를 사용한 파이썬 웹 개발
- pytorch
- MATLAB
- Computer Architecture
- BFS
- rao
- Dreamhack
- 파이토치 트랜스포머를 활용한 자연어 처리와 컴퓨터비전 심층학습
- Kaggle
- study book
- PCA
- Today
- Total
Bull
[kaggle] Image compression using PCA - Review 하기 본문
[kaggle] Image compression using PCA - Review 하기
Bull_ 2024. 7. 29. 18:34이 글은 친구와 kaggle에 익숙해지기 위해 스터디하는 걸 정리해봤습니다.
목적으로 코드도 중요하지만 데이터를 어떻게 다루고 왜 다루고 전처리는 어떤 방식으로 하는 지 궁금해기 때문에 하나하나 관찰하며 혜안을 얻고자 하는 목적입니다.
CODE
https://www.kaggle.com/code/xvivancos/image-compression-using-pca/
Image compression using PCA
Explore and run machine learning code with Kaggle Notebooks | Using data from [Private Datasource]
www.kaggle.com
PCA를 사용한 이미지 압축
3.1 데이터
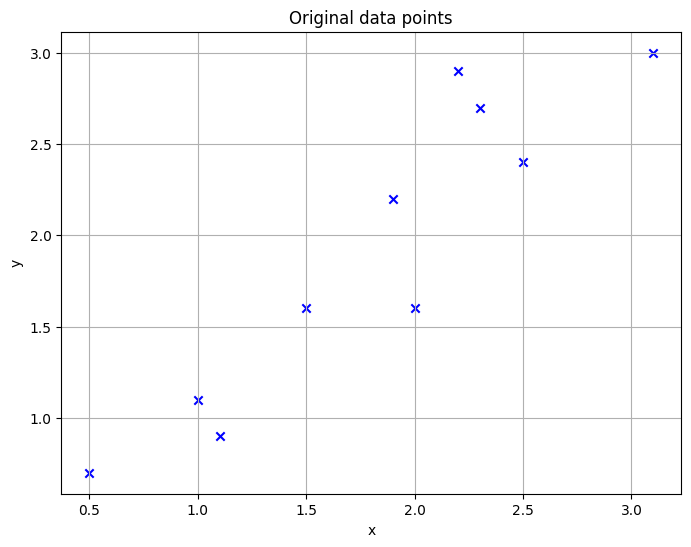
이 알고리즘이 어떻게 작동하는지 연구하기 위해 예제를 살펴보겠습니다. 다음 표에는 x와 y 두 개의 차원만 포함되어 있습니다.
import numpy as np
import pandas as pd
import matplotlib.pyplot as plt

# 데이터 포인트
x = [2.5, 0.5, 2.2, 1.9, 3.1, 2.3, 2.0, 1.0, 1.5, 1.1]
y = [2.4, 0.7, 2.9, 2.2, 3.0, 2.7, 1.6, 1.1, 1.6, 0.9]

# 데이터 프레임 생성
data = pd.DataFrame({'x': x, 'y': y})

# 산점도 그리기
plt.figure(figsize=(8,6))
plt.scatter(data['x'], data['y'], color='blue', marker='x')
plt.title('Original data points')
plt.xlabel('x')
plt.ylabel('y')
plt.grid(True)
plt.show()

3.2 평균을 뺌
각 데이터 차원에서 평균을 뺍니다.
# 평균 계산
mean_x = np.mean(x)
mean_y = np.mean(y)

# 평균을 뺀 값 계산
data_centered = data - [mean_x, mean_y]

# 평균을 뺀 데이터 출력
print("Centered data:\n", data_centered)
Centered data:
x y
0 0.69 0.49
1 -1.31 -1.21
2 0.39 0.99
3 0.09 0.29
4 1.29 1.09
5 0.49 0.79
6 0.19 -0.31
7 -0.81 -0.81
8 -0.31 -0.31
9 -0.71 -1.013.3 공분산 행렬 계산
공분산 행렬을 계산하여 차원 간의 관계를 확인합니다.
# 공분산 행렬 계산
cov_matrix = np.cov(data_centered.T)

# 공분산 행렬 출력
print("Covariance matrix:\n", cov_matrix)
Covariance matrix:
[[0.61655556 0.61544444]
[0.61544444 0.71655556]]3.4 고유벡터와 고유값
공분산 행렬의 고유벡터와 고유값을 계산합니다.
# 고유값과 고유벡터 계산
eigenvalues, eigenvectors = np.linalg.eig(cov_matrix)

# 고유값을 기준으로 정렬
idx = eigenvalues.argsort()[::-1]
eigenvalues = eigenvalues[idx]
eigenvectors = eigenvectors[:, idx]

# 고유값과 고유벡터 출력
print("Eigenvalues:\n", eigenvalues)
print("Eigenvectors:\n", eigenvectors)
Eigenvalues:
[1.28402771 0.0490834 ]
Eigenvectors:
[[-0.6778734 -0.73517866]
[-0.73517866 0.6778734 ]]3.5 주성분 선택
고유값을 기준으로 주성분을 선택하고, 중요도를 분석합니다.
# 주성분의 중요도 분석
variance_explained = eigenvalues / np.sum(eigenvalues)
cumulative_variance_explained = np.cumsum(variance_explained)

# 중요도 분석 출력
print("Proportion of Variance:\n", variance_explained)
print("Cumulative Proportion of Variance:\n", cumulative_variance_explained)
Proportion of Variance:
[0.96318131 0.03681869]
Cumulative Proportion of Variance:
[0.96318131 1. ]3.6 새로운 데이터셋 도출
선택한 주성분을 사용하여 데이터를 새로운 주성분 공간으로 투영합니다.
# 데이터를 주성분 공간으로 변환
transformed_data = np.dot(data_centered, eigenvectors)

# 새로운 데이터셋 생성
data_new_axes = pd.DataFrame(transformed_data, columns=['First Component', 'Second Component'])

# 새로운 데이터셋 출력
print("New data set in terms of the 2 eigenvectors:\n", data_new_axes)

# 시각화
plt.figure(figsize=(8,6))
plt.scatter(data_new_axes['First Component'], data_new_axes['Second Component'], color='blue', marker='x')
plt.title('Data expressed in terms of our 2 eigenvectors')
plt.xlabel('First Component')
plt.ylabel('Second Component')
plt.grid(True)
plt.show()
3.7 원래 데이터 복원
첫 번째 주성분만 사용하여 데이터를 복원합니다.
# 첫 번째 주성분만 사용하여 데이터 복원
reconstructed_data = np.outer(transformed_data[:, 0], eigenvectors[:, 0]) + [mean_x, mean_y]

# 복원된 데이터 출력
print("Reconstructed data using only the first principal component:\n", reconstructed_data)

# 시각화
plt.figure(figsize=(8,6))
plt.scatter(data['x'], data['y'], color='blue', marker='x', label='Original Data')
plt.scatter(reconstructed_data[:, 0], reconstructed_data[:, 1], color='red', marker='o', label='Reconstructed Data (1 PC)')
plt.title('Original and Reconstructed Data')
plt.xlabel('x')
plt.ylabel('y')
plt.legend()
plt.grid(True)
plt.show()

4. 이미지 압축
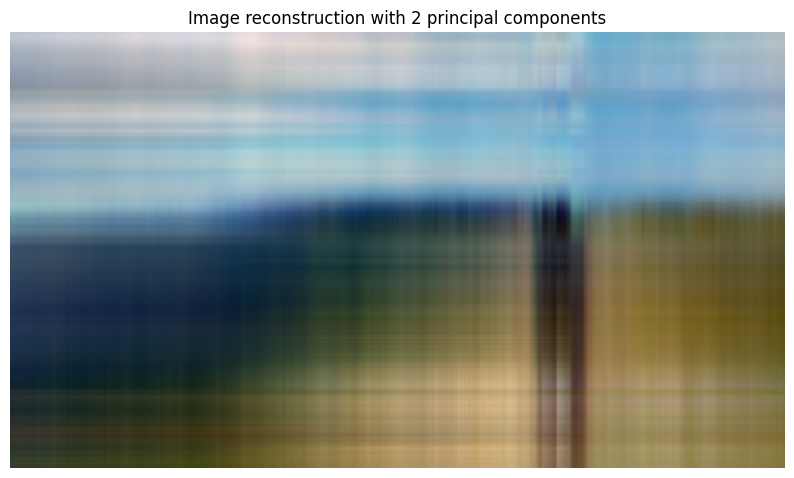
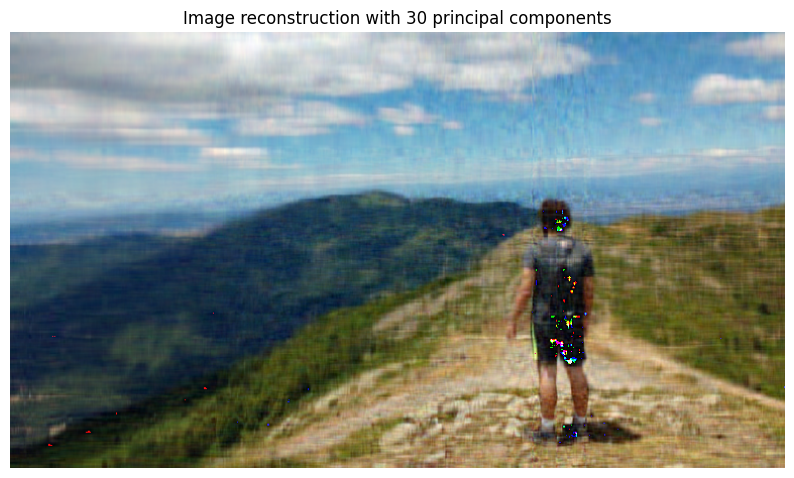
PCA 방법을 더 잘 이해했으니, 이제 이미지 압축과 관련된 더 흥미로운 예제를 보여드리겠습니다. 주성분의 수가 증가함에 따라 재구성된 이미지가 원본 이미지와 더 유사해지는 것을 볼 수 있습니다. 몇 개의 주성분이 품질을 유지하면서 이미지를 압축하는 데 충분할까요?
4.1 이미지 로드
먼저 이미지를 읽어옵니다.
from skimage import io
import matplotlib.pyplot as plt

# 이미지 읽기
image = io.imread('image.jpg')

# 이미지 구조와 차원 확인
print("Image dimensions:", image.shape)
plt.imshow(image)
plt.title("Original Image")
plt.axis('off')
plt.show()
4.2 PCA 수행
각 색상 채널을 별도로 처리하기 위해 세 개의 데이터 프레임으로 나눕니다.
# RGB 색상 행렬 분리
rimage = image[:, :, 0]
gimage = image[:, :, 1]
bimage = image[:, :, 2]

# 각 색상 채널에 대해 PCA 수행
from sklearn.decomposition import PCA

pca_r = PCA()
pca_g = PCA()
pca_b = PCA()

rimage_pca = pca_r.fit_transform(rimage)
gimage_pca = pca_g.fit_transform(gimage)
bimage_pca = pca_b.fit_transform(bimage)

# PCA 객체 리스트로 저장
pcaimage = [pca_r, pca_g, pca_b]
4.3 Scree plot 및 누적 분산 플롯
각 주성분이 설명하는 분산의 비율을 시각화합니다.
import pandas as pd
import seaborn as sns

# 데이터 프레임 생성
df_r = pd.DataFrame({
    'index': range(1, len(pca_r.explained_variance_ratio_) + 1),
    'var': pca_r.explained_variance_ratio_,
    'cumsum': np.cumsum(pca_r.explained_variance_ratio_)
})

df_g = pd.DataFrame({
    'index': range(1, len(pca_g.explained_variance_ratio_) + 1),
    'var': pca_g.explained_variance_ratio_,
    'cumsum': np.cumsum(pca_g.explained_variance_ratio_)
})

df_b = pd.DataFrame({
    'index': range(1, len(pca_b.explained_variance_ratio_) + 1),
    'var': pca_b.explained_variance_ratio_,
    'cumsum': np.cumsum(pca_b.explained_variance_ratio_)
})

# 3x2 형식으로 플롯 생성
fig, axes = plt.subplots(3, 2, figsize=(18, 18))

# Scree plot for R
sns.barplot(x='index', y='var', data=df_r, ax=axes[0, 0], color='red')
axes[0, 0].plot(df_r['index'], df_r['var'], marker='o', linestyle='-')
axes[0, 0].set_title('Scree plot for R')
axes[0, 0].set_xlabel('Principal Component')
axes[0, 0].set_ylabel('% of Variance')

# Cumulative plot for R
sns.lineplot(x='index', y='cumsum', data=df_r, ax=axes[0, 1], color='red')
axes[0, 1].set_title('Cumulative proportion of variance explained for R')
axes[0, 1].set_xlabel('Principal Component')
axes[0, 1].set_ylabel('Cumulative % of Variance')

# Scree plot for G
sns.barplot(x='index', y='var', data=df_g, ax=axes[1, 0], color='green')
axes[1, 0].plot(df_g['index'], df_g['var'], marker='o', linestyle='-')
axes[1, 0].set_title('Scree plot for G')
axes[1, 0].set_xlabel('Principal Component')
axes[1, 0].set_ylabel('% of Variance')

# Cumulative plot for G
sns.lineplot(x='index', y='cumsum', data=df_g, ax=axes[1, 1], color='green')
axes[1, 1].set_title('Cumulative proportion of variance explained for G')
axes[1, 1].set_xlabel('Principal Component')
axes[1, 1].set_ylabel('Cumulative % of Variance')

# Scree plot for B
sns.barplot(x='index', y='var', data=df_b, ax=axes[2, 0], color='blue')
axes[2, 0].plot(df_b['index'], df_b['var'], marker='o', linestyle='-')
axes[2, 0].set_title('Scree plot for B')
axes[2, 0].set_xlabel('Principal Component')
axes[2, 0].set_ylabel('% of Variance')

# Cumulative plot for B
sns.lineplot(x='index', y='cumsum', data=df_b, ax=axes[2, 1], color='blue')
axes[2, 1].set_title('Cumulative proportion of variance explained for B')
axes[2, 1].set_xlabel('Principal Component')
axes[2, 1].set_ylabel('Cumulative % of Variance')

plt.tight_layout()
plt.show()
4.4 이미지 재구성
다음 코드에서는 2, 30, 200, 300개의 주성분을 사용하여 이미지를 네 번 재구성합니다.
from skimage.io import imsave

# 주성분 수
pcnum = [2, 30, 200, 300]

# 이미지 재구성 및 저장
for i in pcnum:
    pca_r_i = PCA(n_components=i)
    pca_g_i = PCA(n_components=i)
    pca_b_i = PCA(n_components=i)

    rimage_pca_i = pca_r_i.fit_transform(rimage)
    gimage_pca_i = pca_g_i.fit_transform(gimage)
    bimage_pca_i = pca_b_i.fit_transform(bimage)

    r_reconstructed = pca_r_i.inverse_transform(rimage_pca_i)
    g_reconstructed = pca_g_i.inverse_transform(gimage_pca_i)
    b_reconstructed = pca_b_i.inverse_transform(bimage_pca_i)

    reconstructed_image = np.stack((r_reconstructed, g_reconstructed, b_reconstructed), axis=2).astype(np.uint8)
    imsave(f"reconstructed_image_{i}_components.jpg", reconstructed_image)

    plt.figure(figsize=(10, 8))
    plt.imshow(reconstructed_image)
    plt.title(f"Image reconstruction with {i} principal components")
    plt.axis('off')
    plt.show()


'Artificial Intelligence > kaggle' 카테고리의 다른 글
| [kaggle] 🐘Greyscale MobileNet [LB=0.892] - Review 하기 (0) | 2024.08.05 |
|---|---|
| [kaggle] Single model baseline: XGBoost - Review하기 (6) | 2024.07.22 |
| [kaggle] Gensim Word2Vec Tutorial - Review하기 (0) | 2024.07.21 |


